.png)
ggplot2常用绘图代码
240
2023-08-28
数据结构及加载包
> gapdata
# A tibble: 1,704 × 6
   country     continent  year lifeExp      pop gdpPercap
   <chr>       <chr>     <dbl>   <dbl>    <dbl>     <dbl>
 1 Afghanistan Asia       1952    28.8  8425333      779.
 2 Afghanistan Asia       1957    30.3  9240934      821.
 3 Afghanistan Asia       1962    32.0 10267083      853.
 4 Afghanistan Asia       1967    34.0 11537966      836.
 5 Afghanistan Asia       1972    36.1 13079460      740.
 6 Afghanistan Asia       1977    38.4 14880372      786.
 7 Afghanistan Asia       1982    39.9 12881816      978.
 8 Afghanistan Asia       1987    40.8 13867957      852.
 9 Afghanistan Asia       1992    41.7 16317921      649.
10 Afghanistan Asia       1997    41.8 22227415      635.
library(tidyverse)
library(gghighlight)
library(cowplot)
library(patchwork)
library(ggforce)
library(ggridges)各类图形绘制
gapdata %>%
ggplot(aes(x = continent, y = lifeExp)) +
geom_boxplot() +
geom_jitter()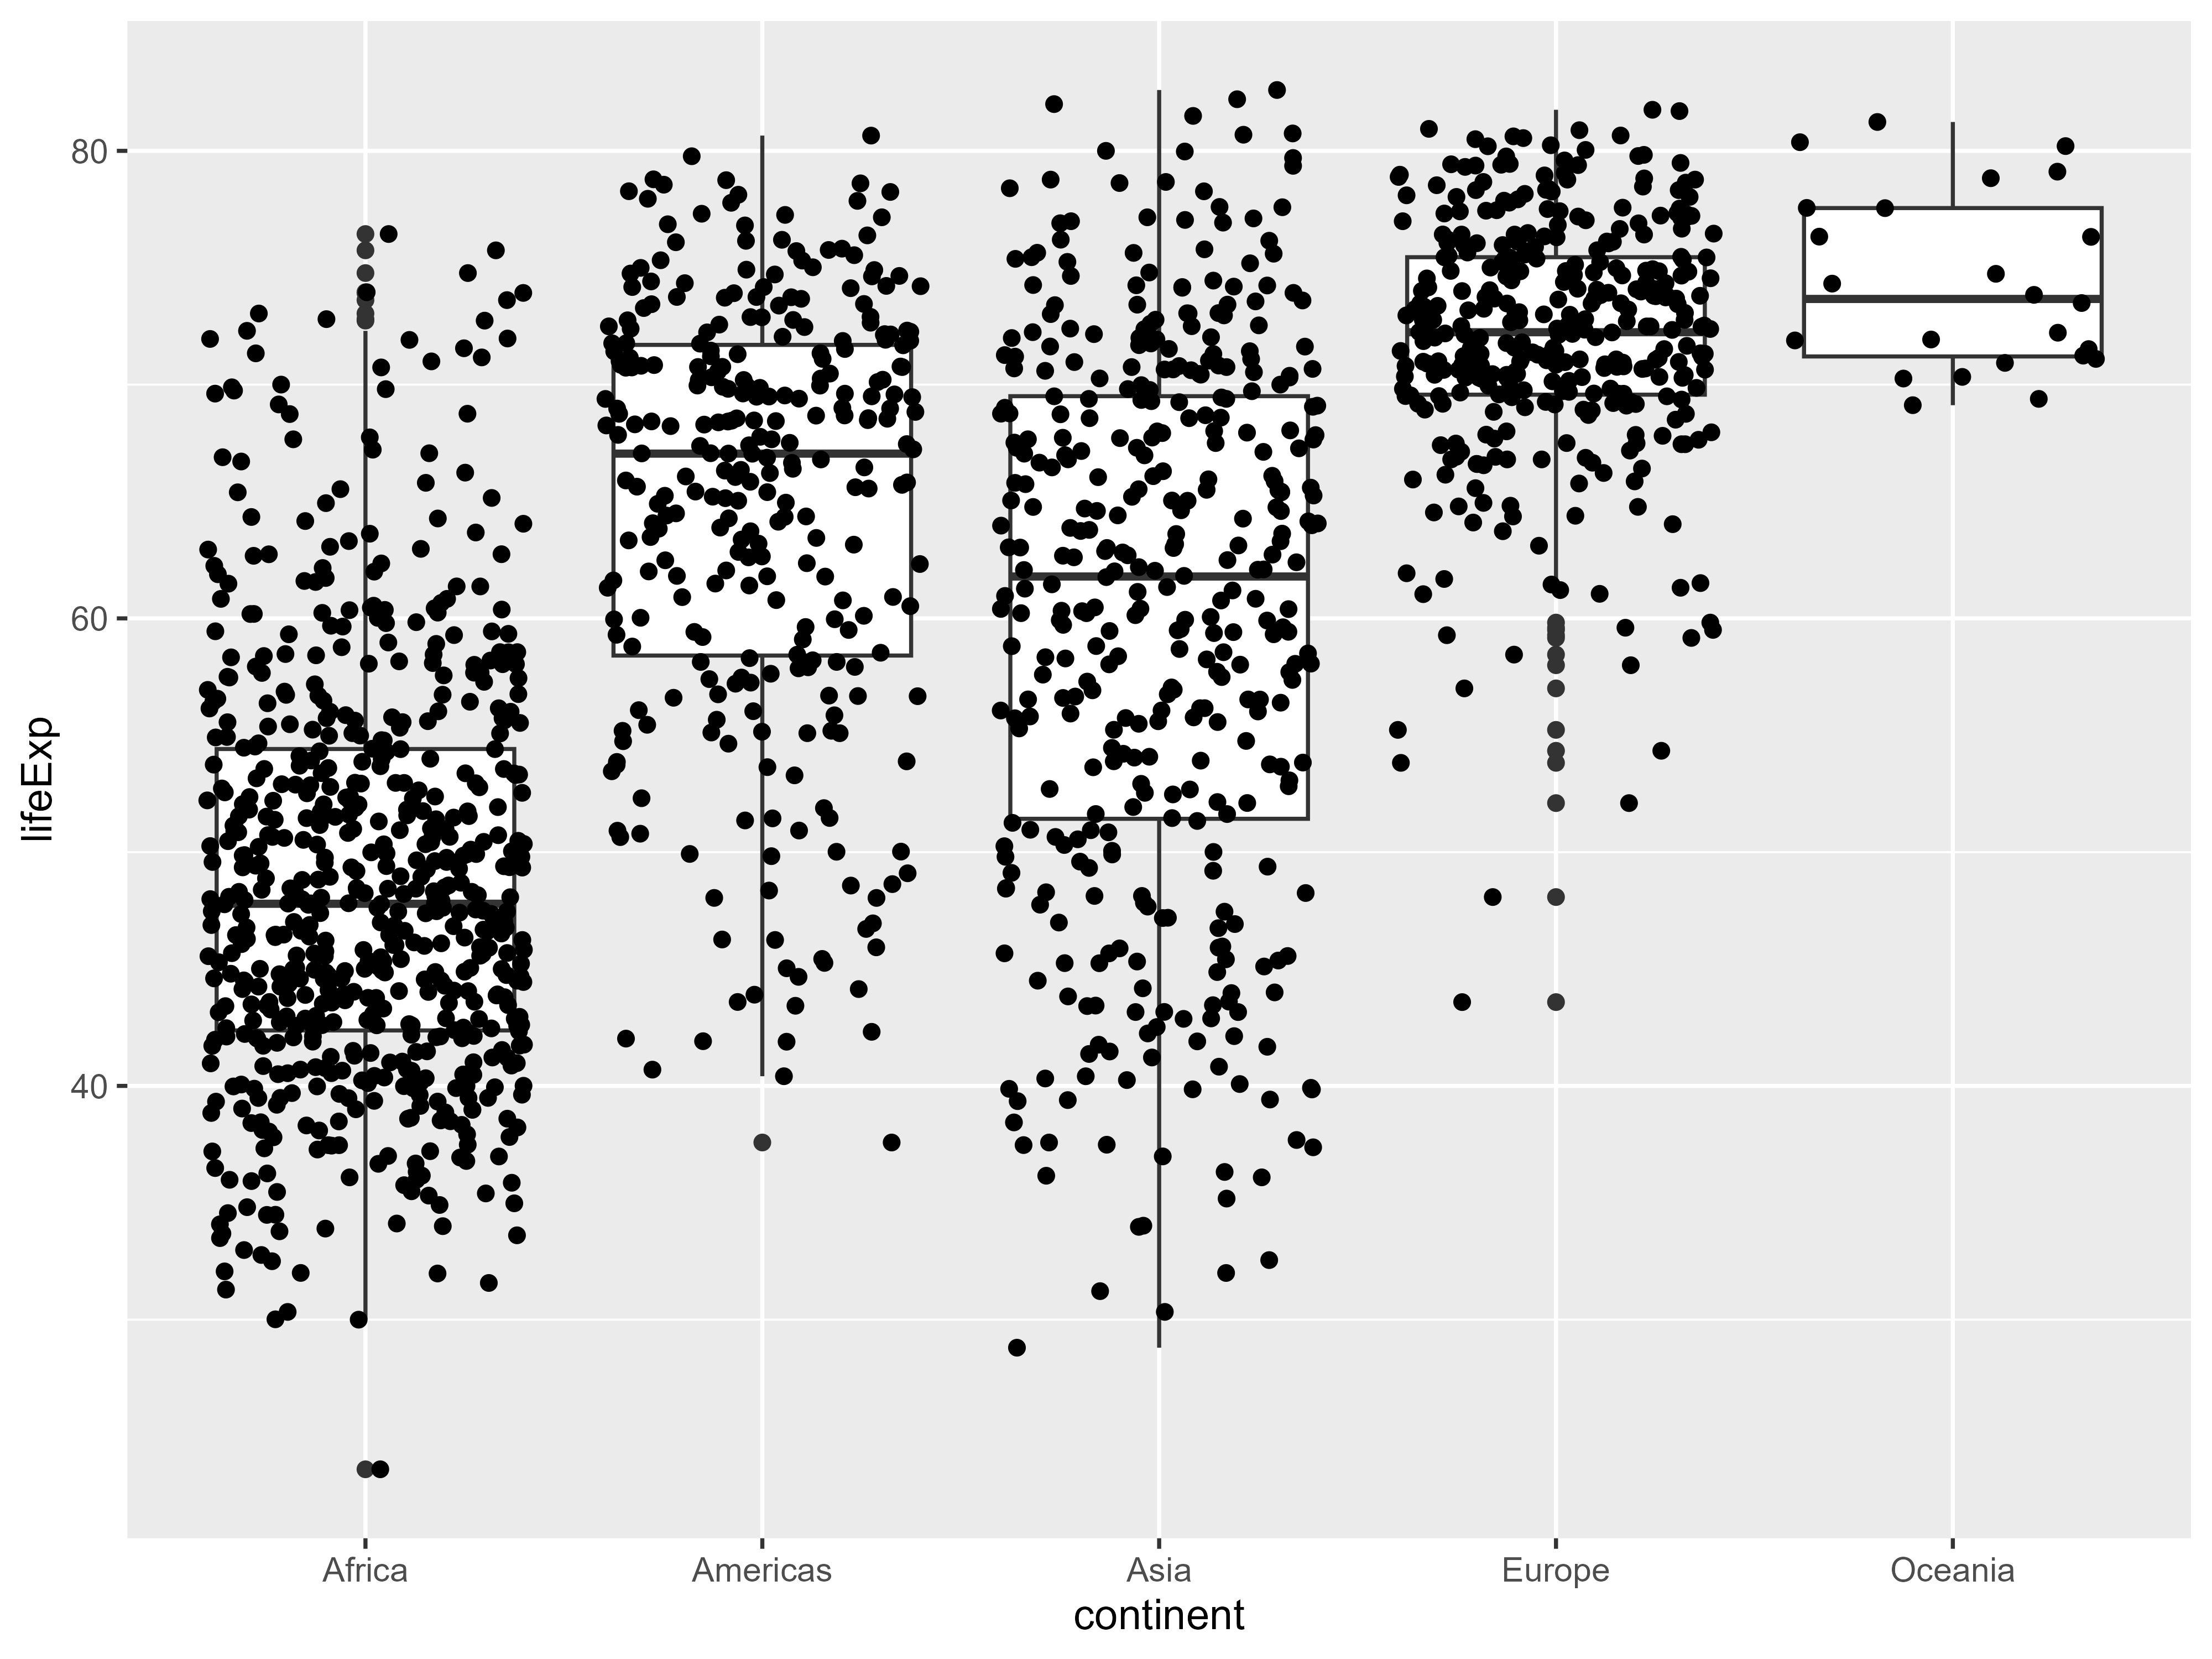 histogram
gapdata %>%
ggplot(aes(x = lifeExp, fill = continent)) +
geom_histogram()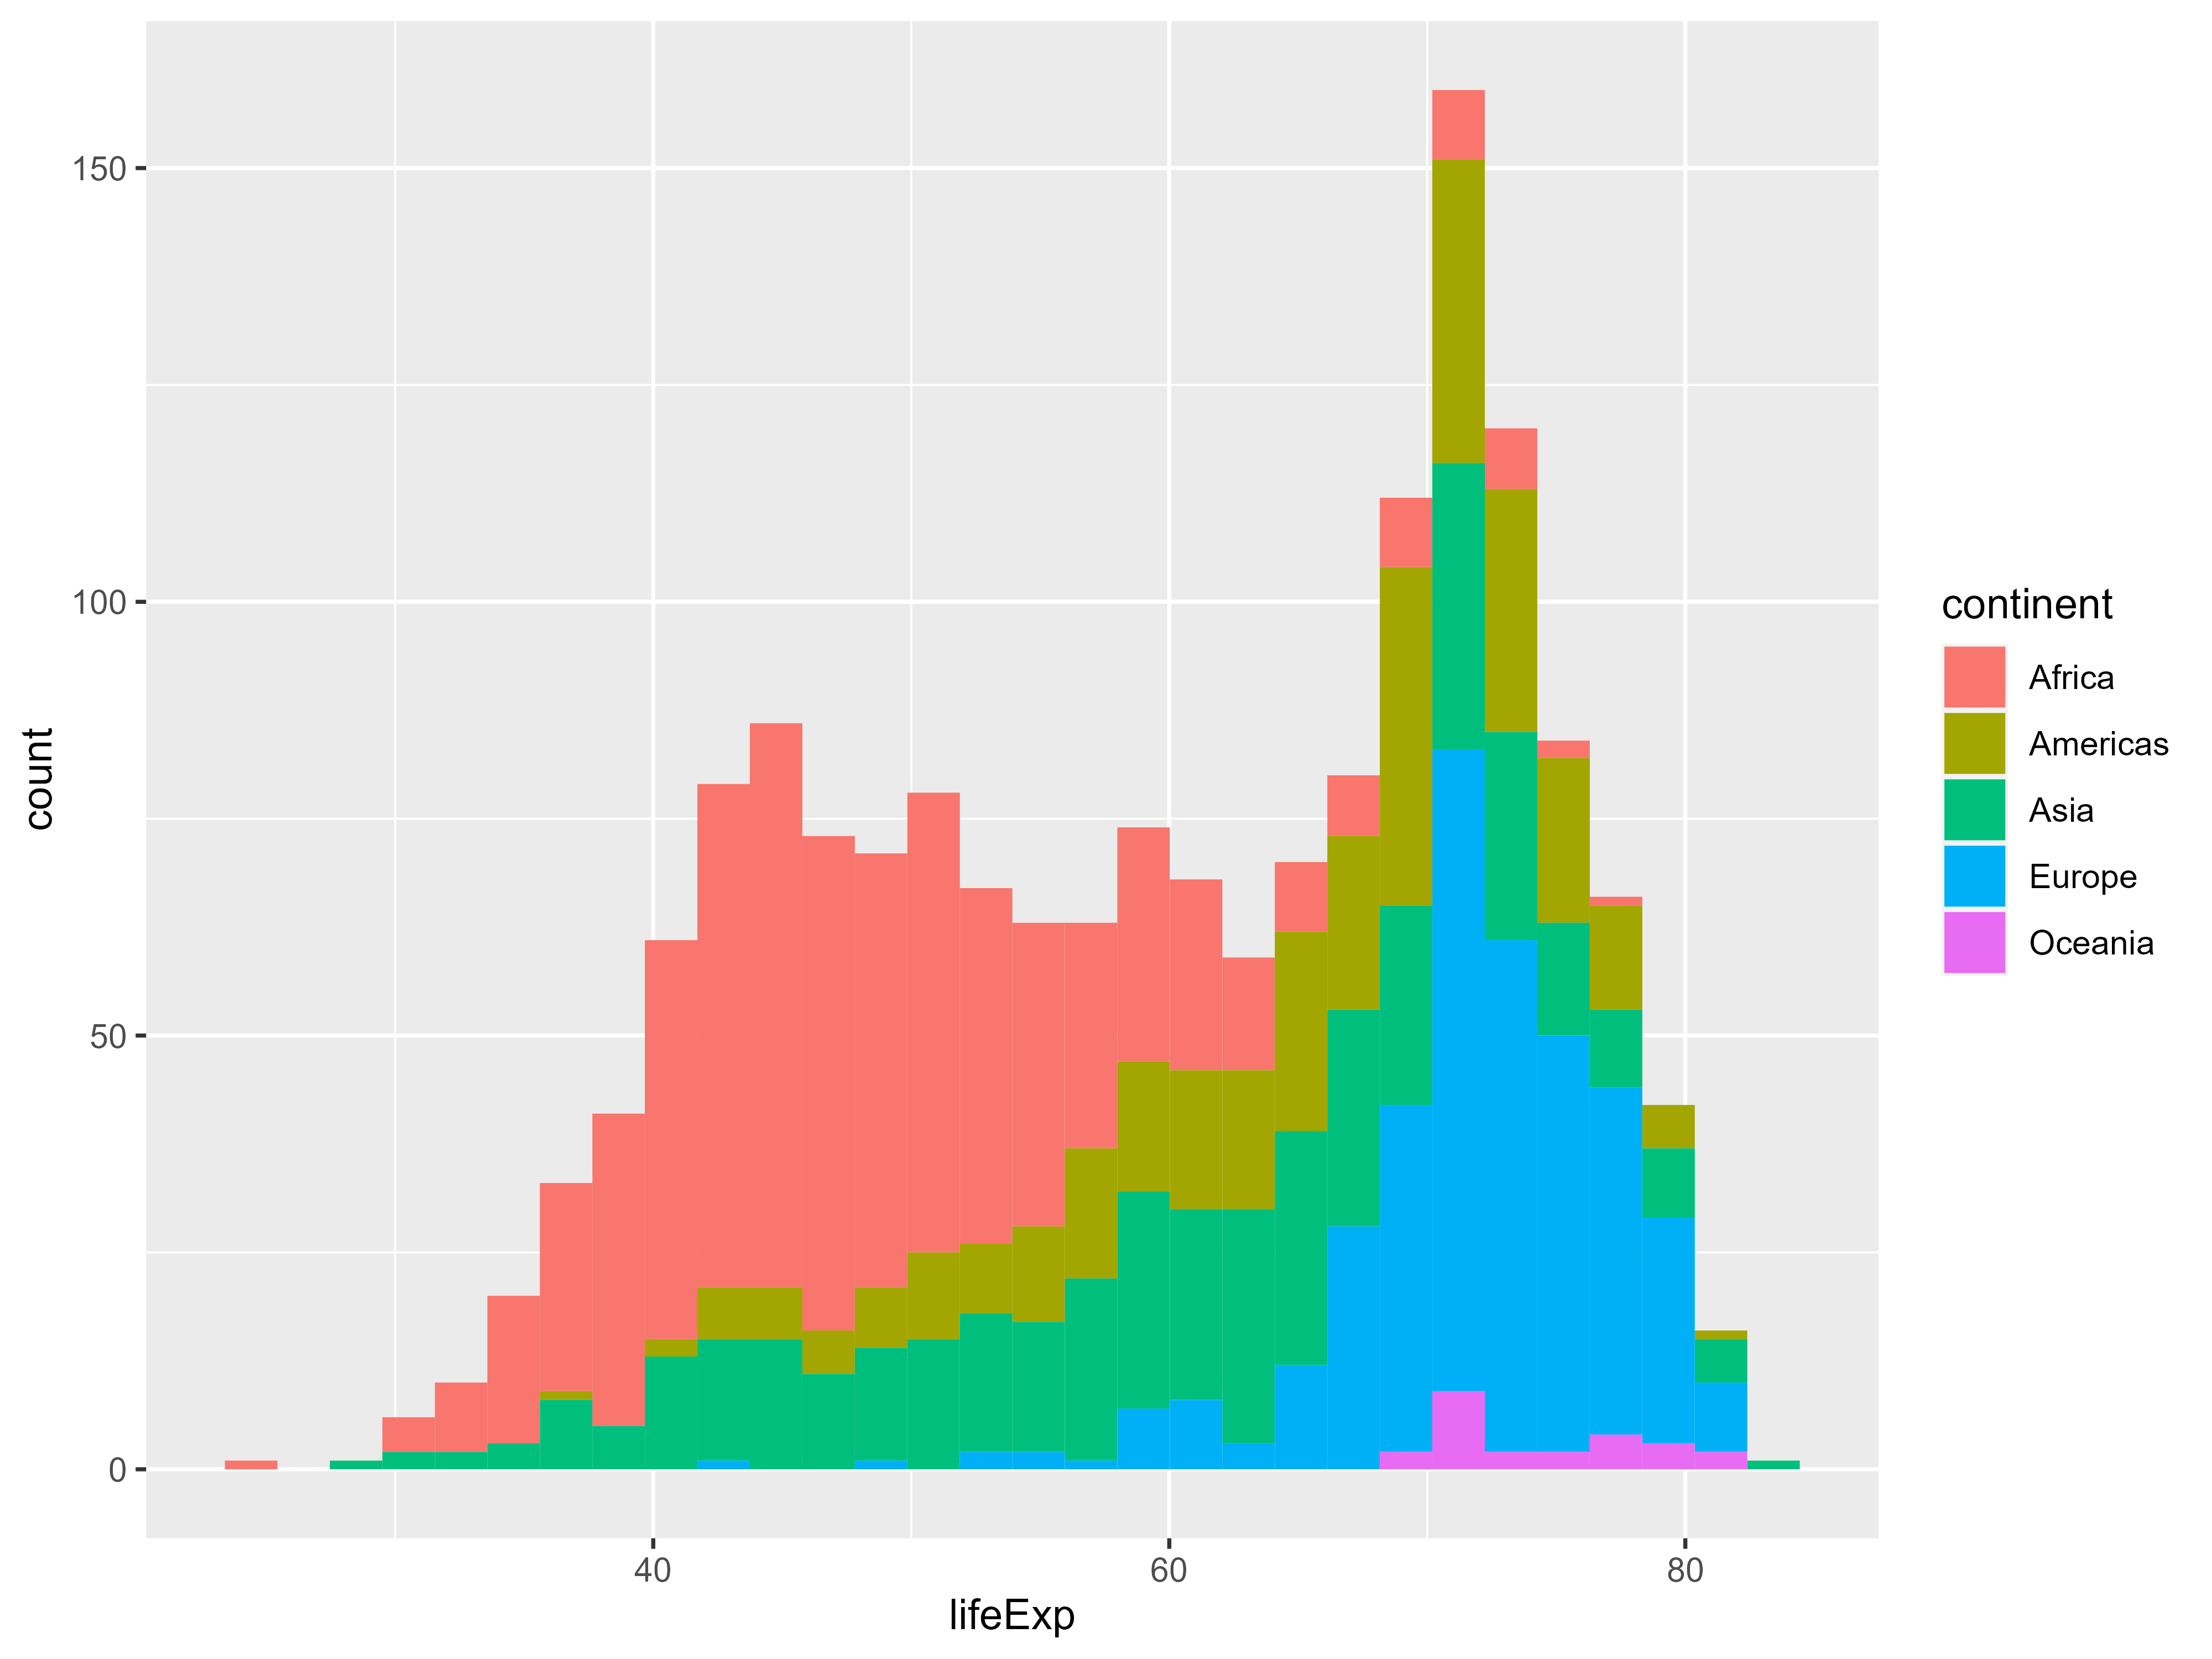 density
gapdata %>%
ggplot(aes(x = lifeExp, fill = continent)) +
geom_density(alpha = 0.2)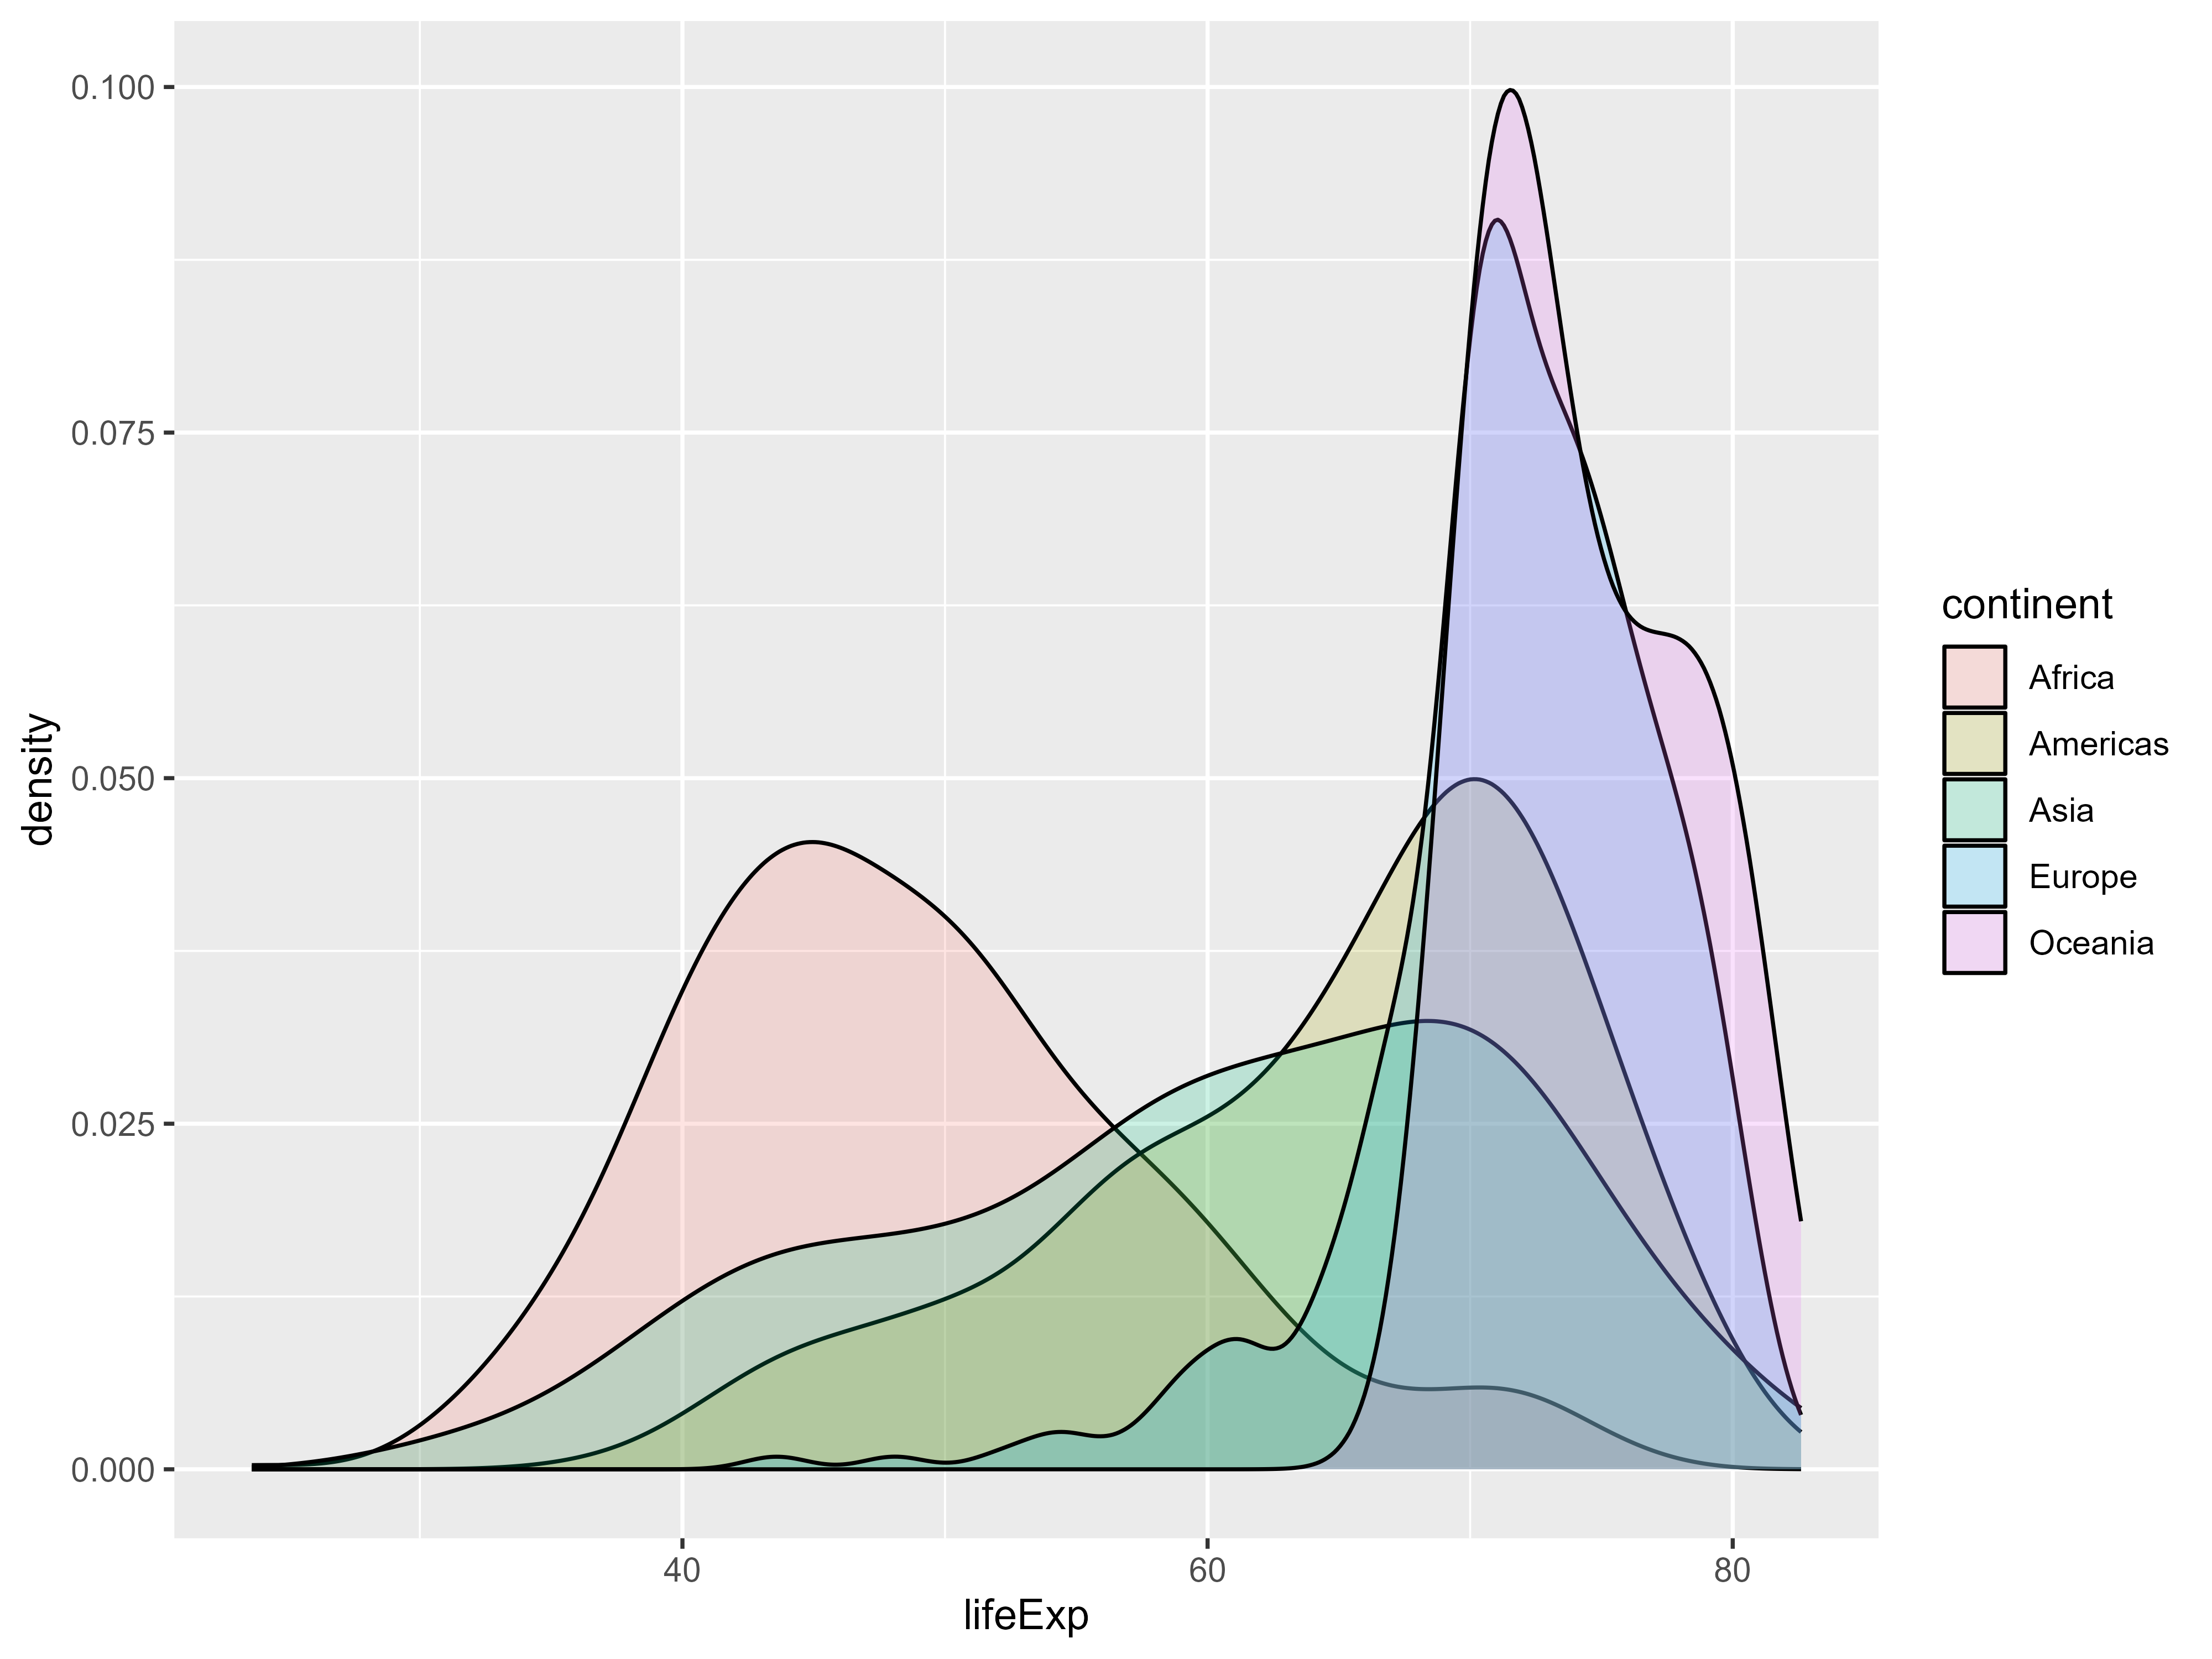 分面图facet_
gapdata %>%
  ggplot(aes(x = lifeExp)) +
  geom_density() +
  facet_grid(. ~ continent)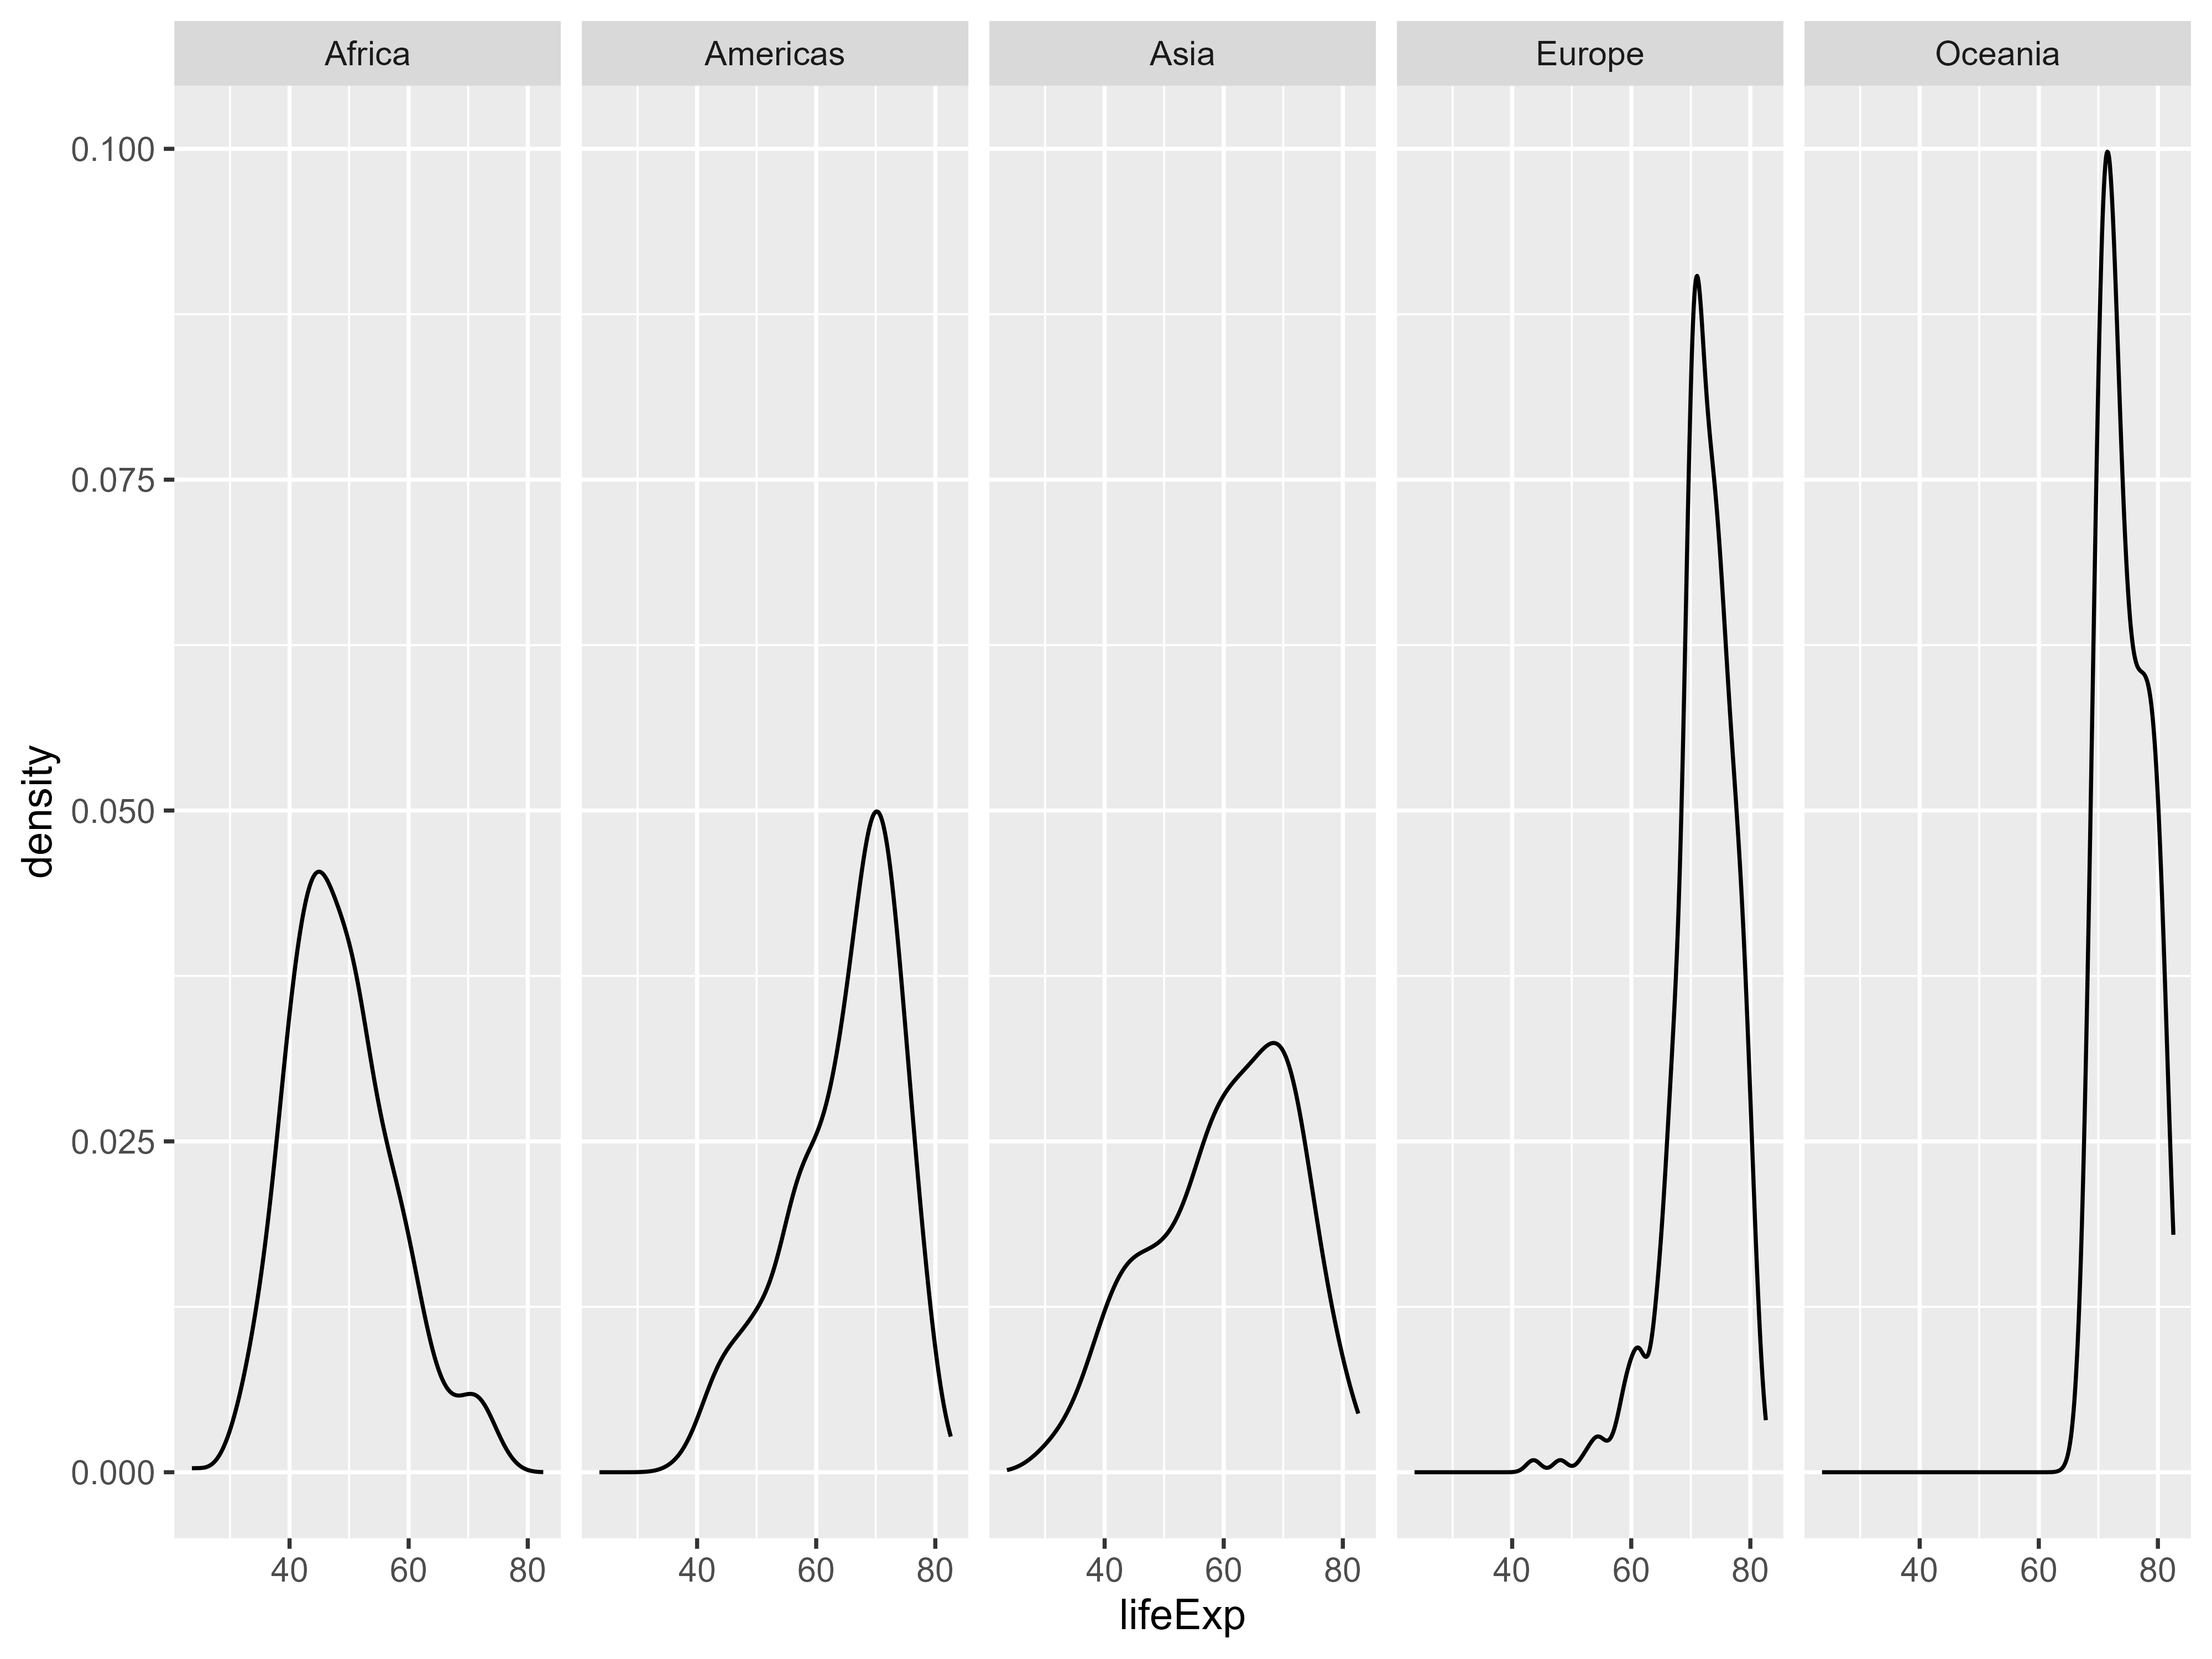
gapdata %>%
  filter(continent != "Oceania") %>%
  ggplot(aes(x = lifeExp, fill = continent)) +
  geom_histogram() +
  facet_grid(continent ~ .)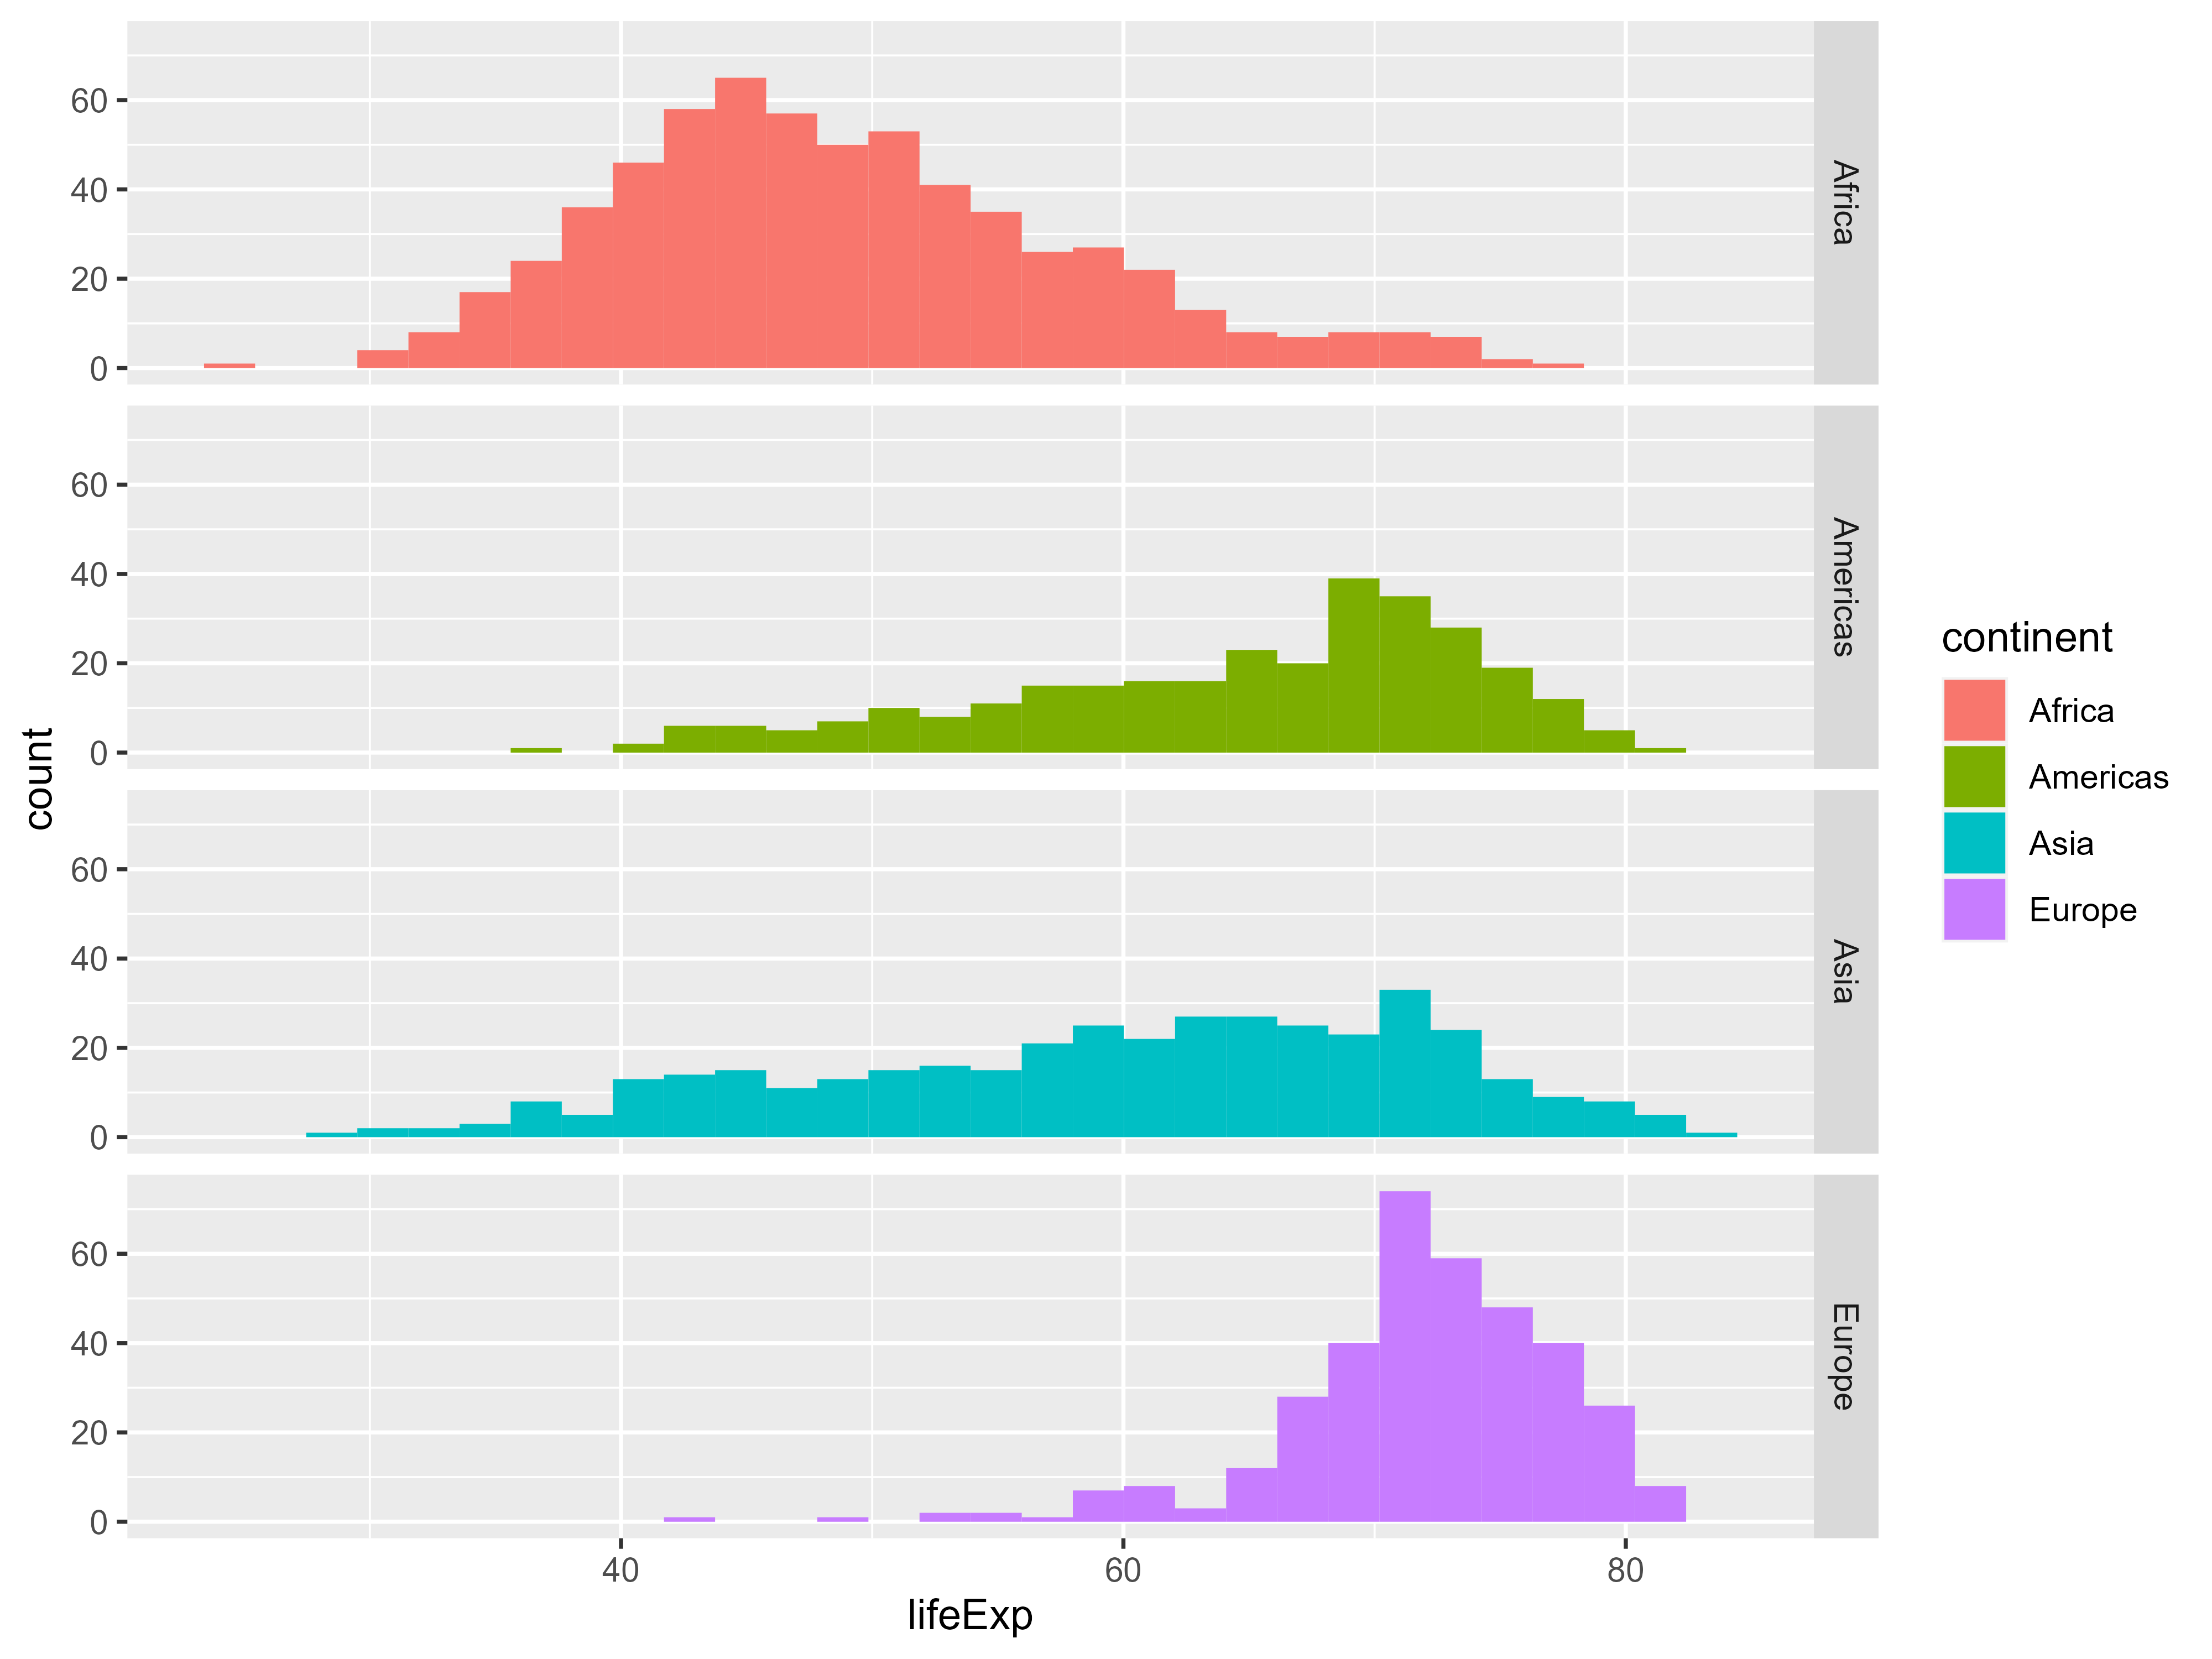
gapdata %>%
  filter(continent != "Oceania") %>%
  ggplot(aes(x = lifeExp, y = stat(density))) +
  geom_histogram(aes(fill = continent)) +
  geom_density() +
  facet_grid(continent ~ .)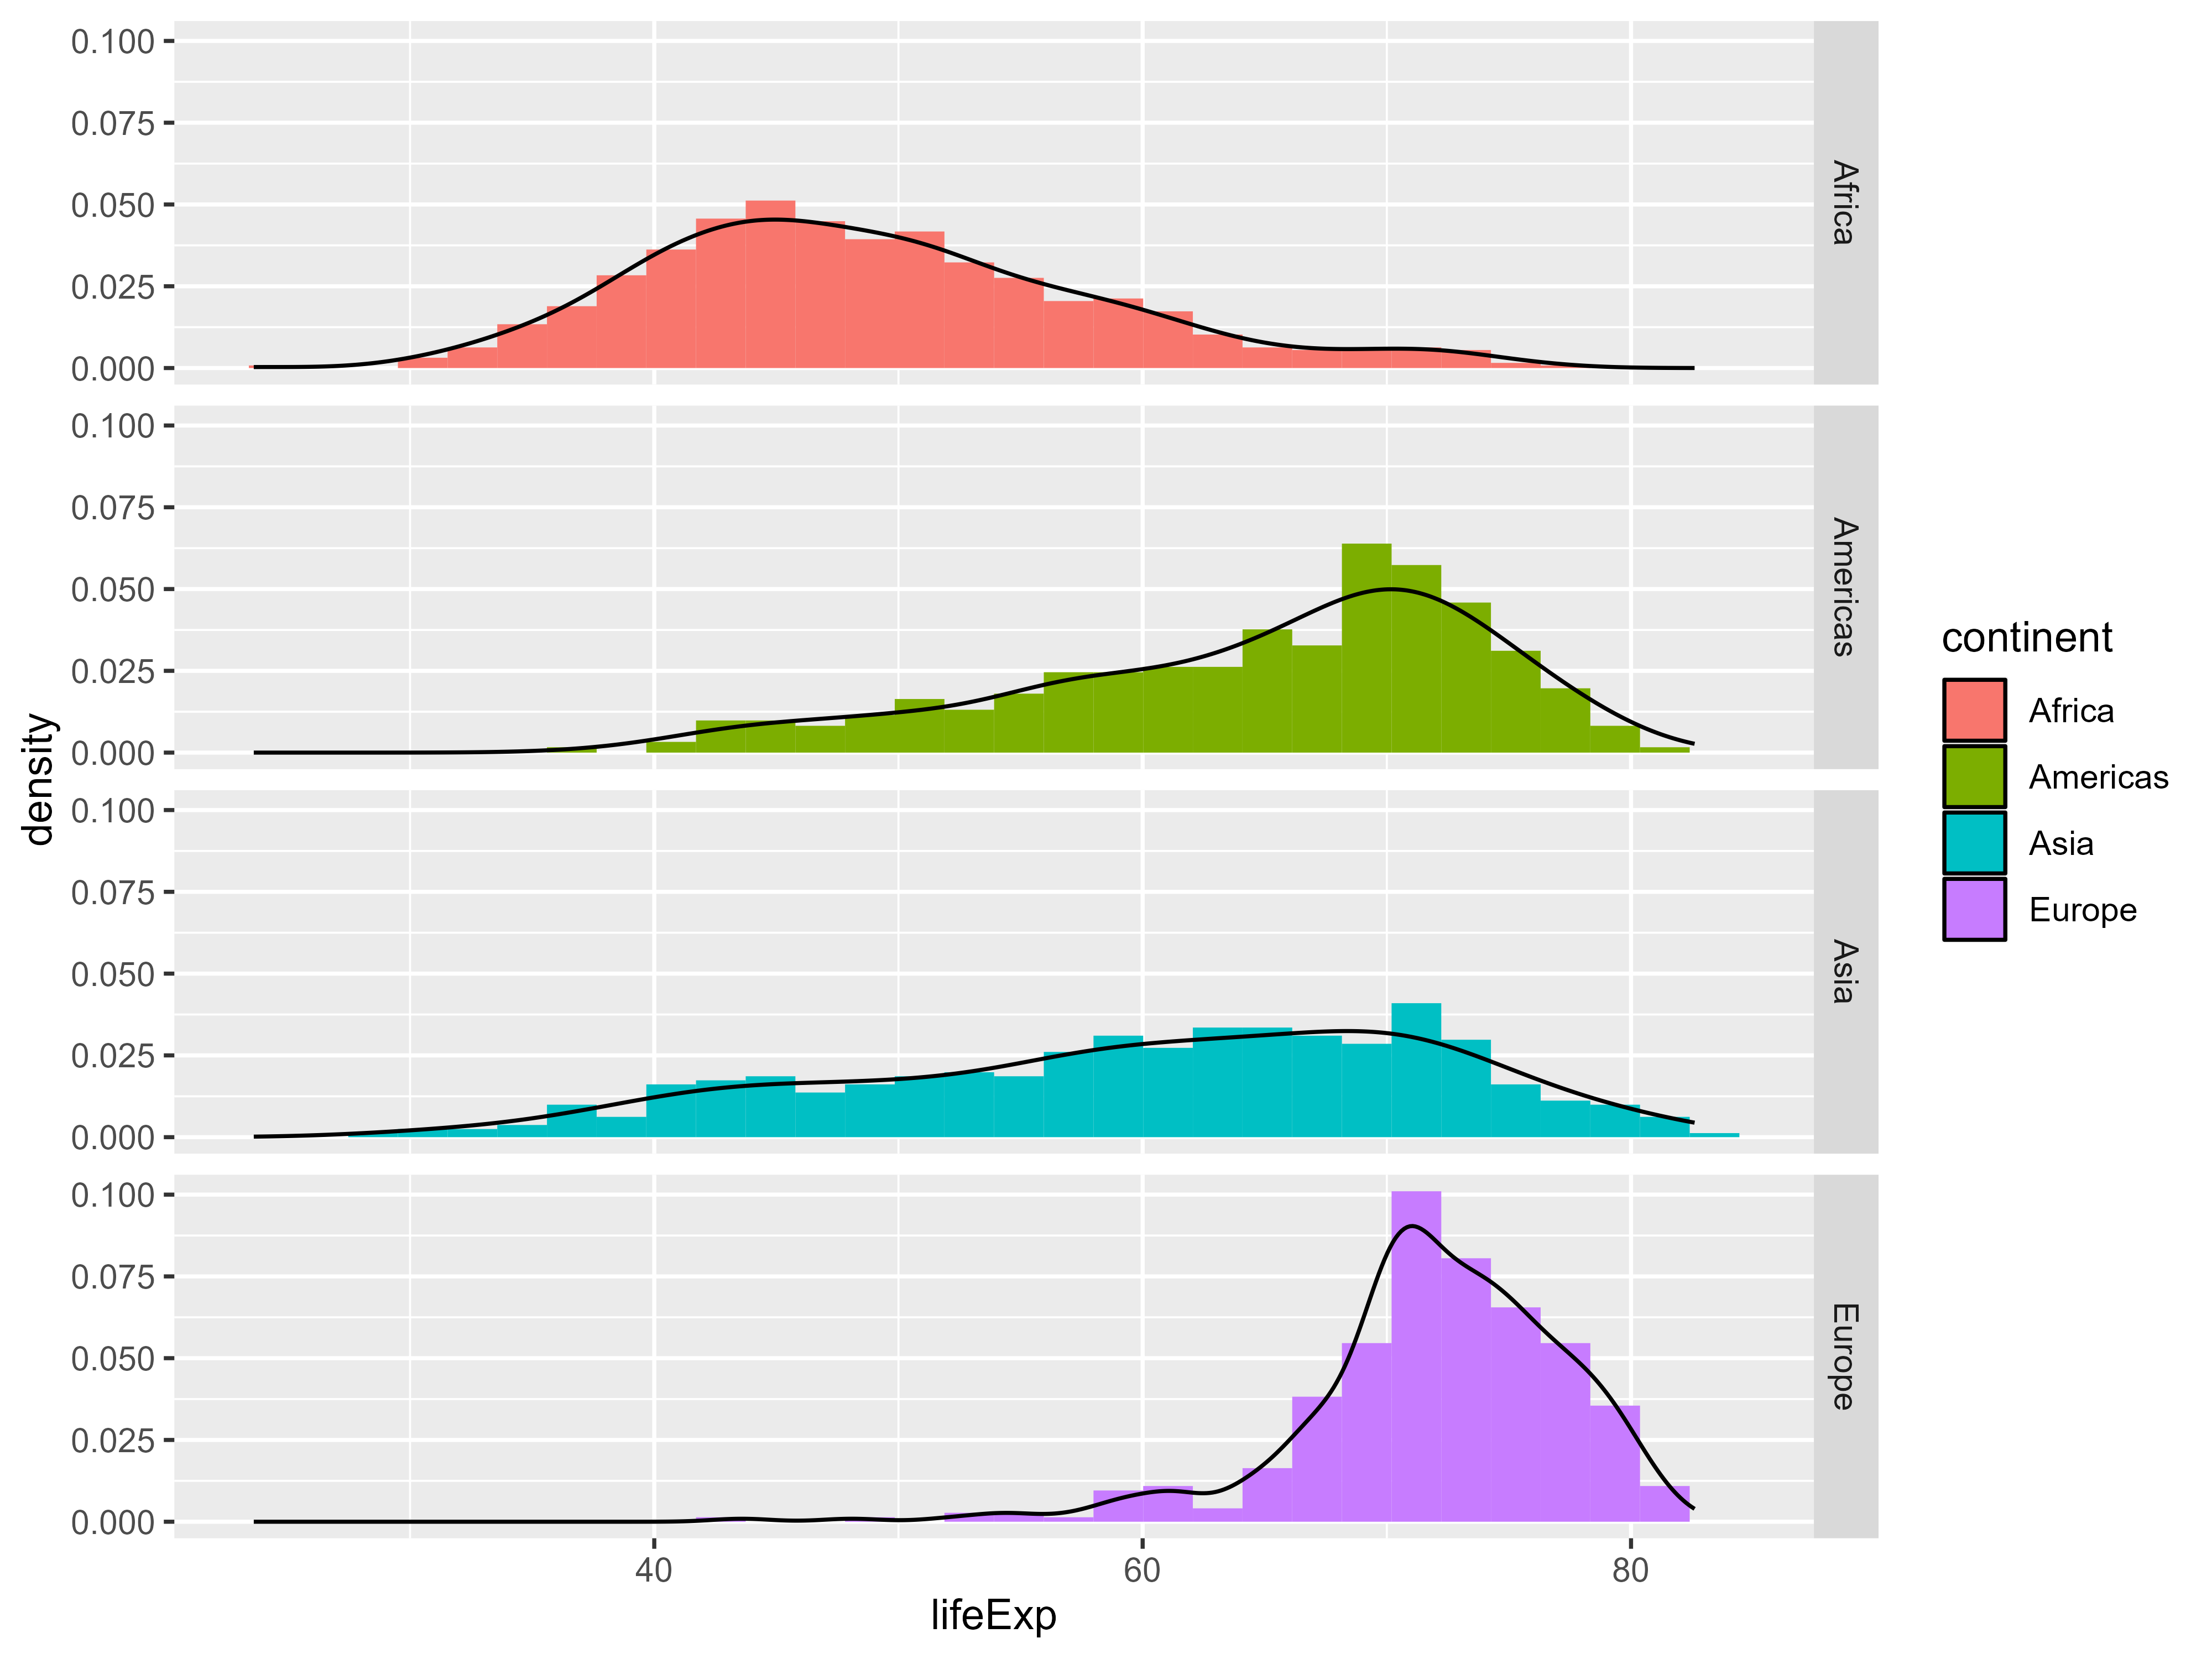
gapdata %>%
  ggplot(aes(x = gdpPercap, y = lifeExp, color = continent)) +
  geom_point(show.legend = FALSE) +
  facet_wrap(~continent)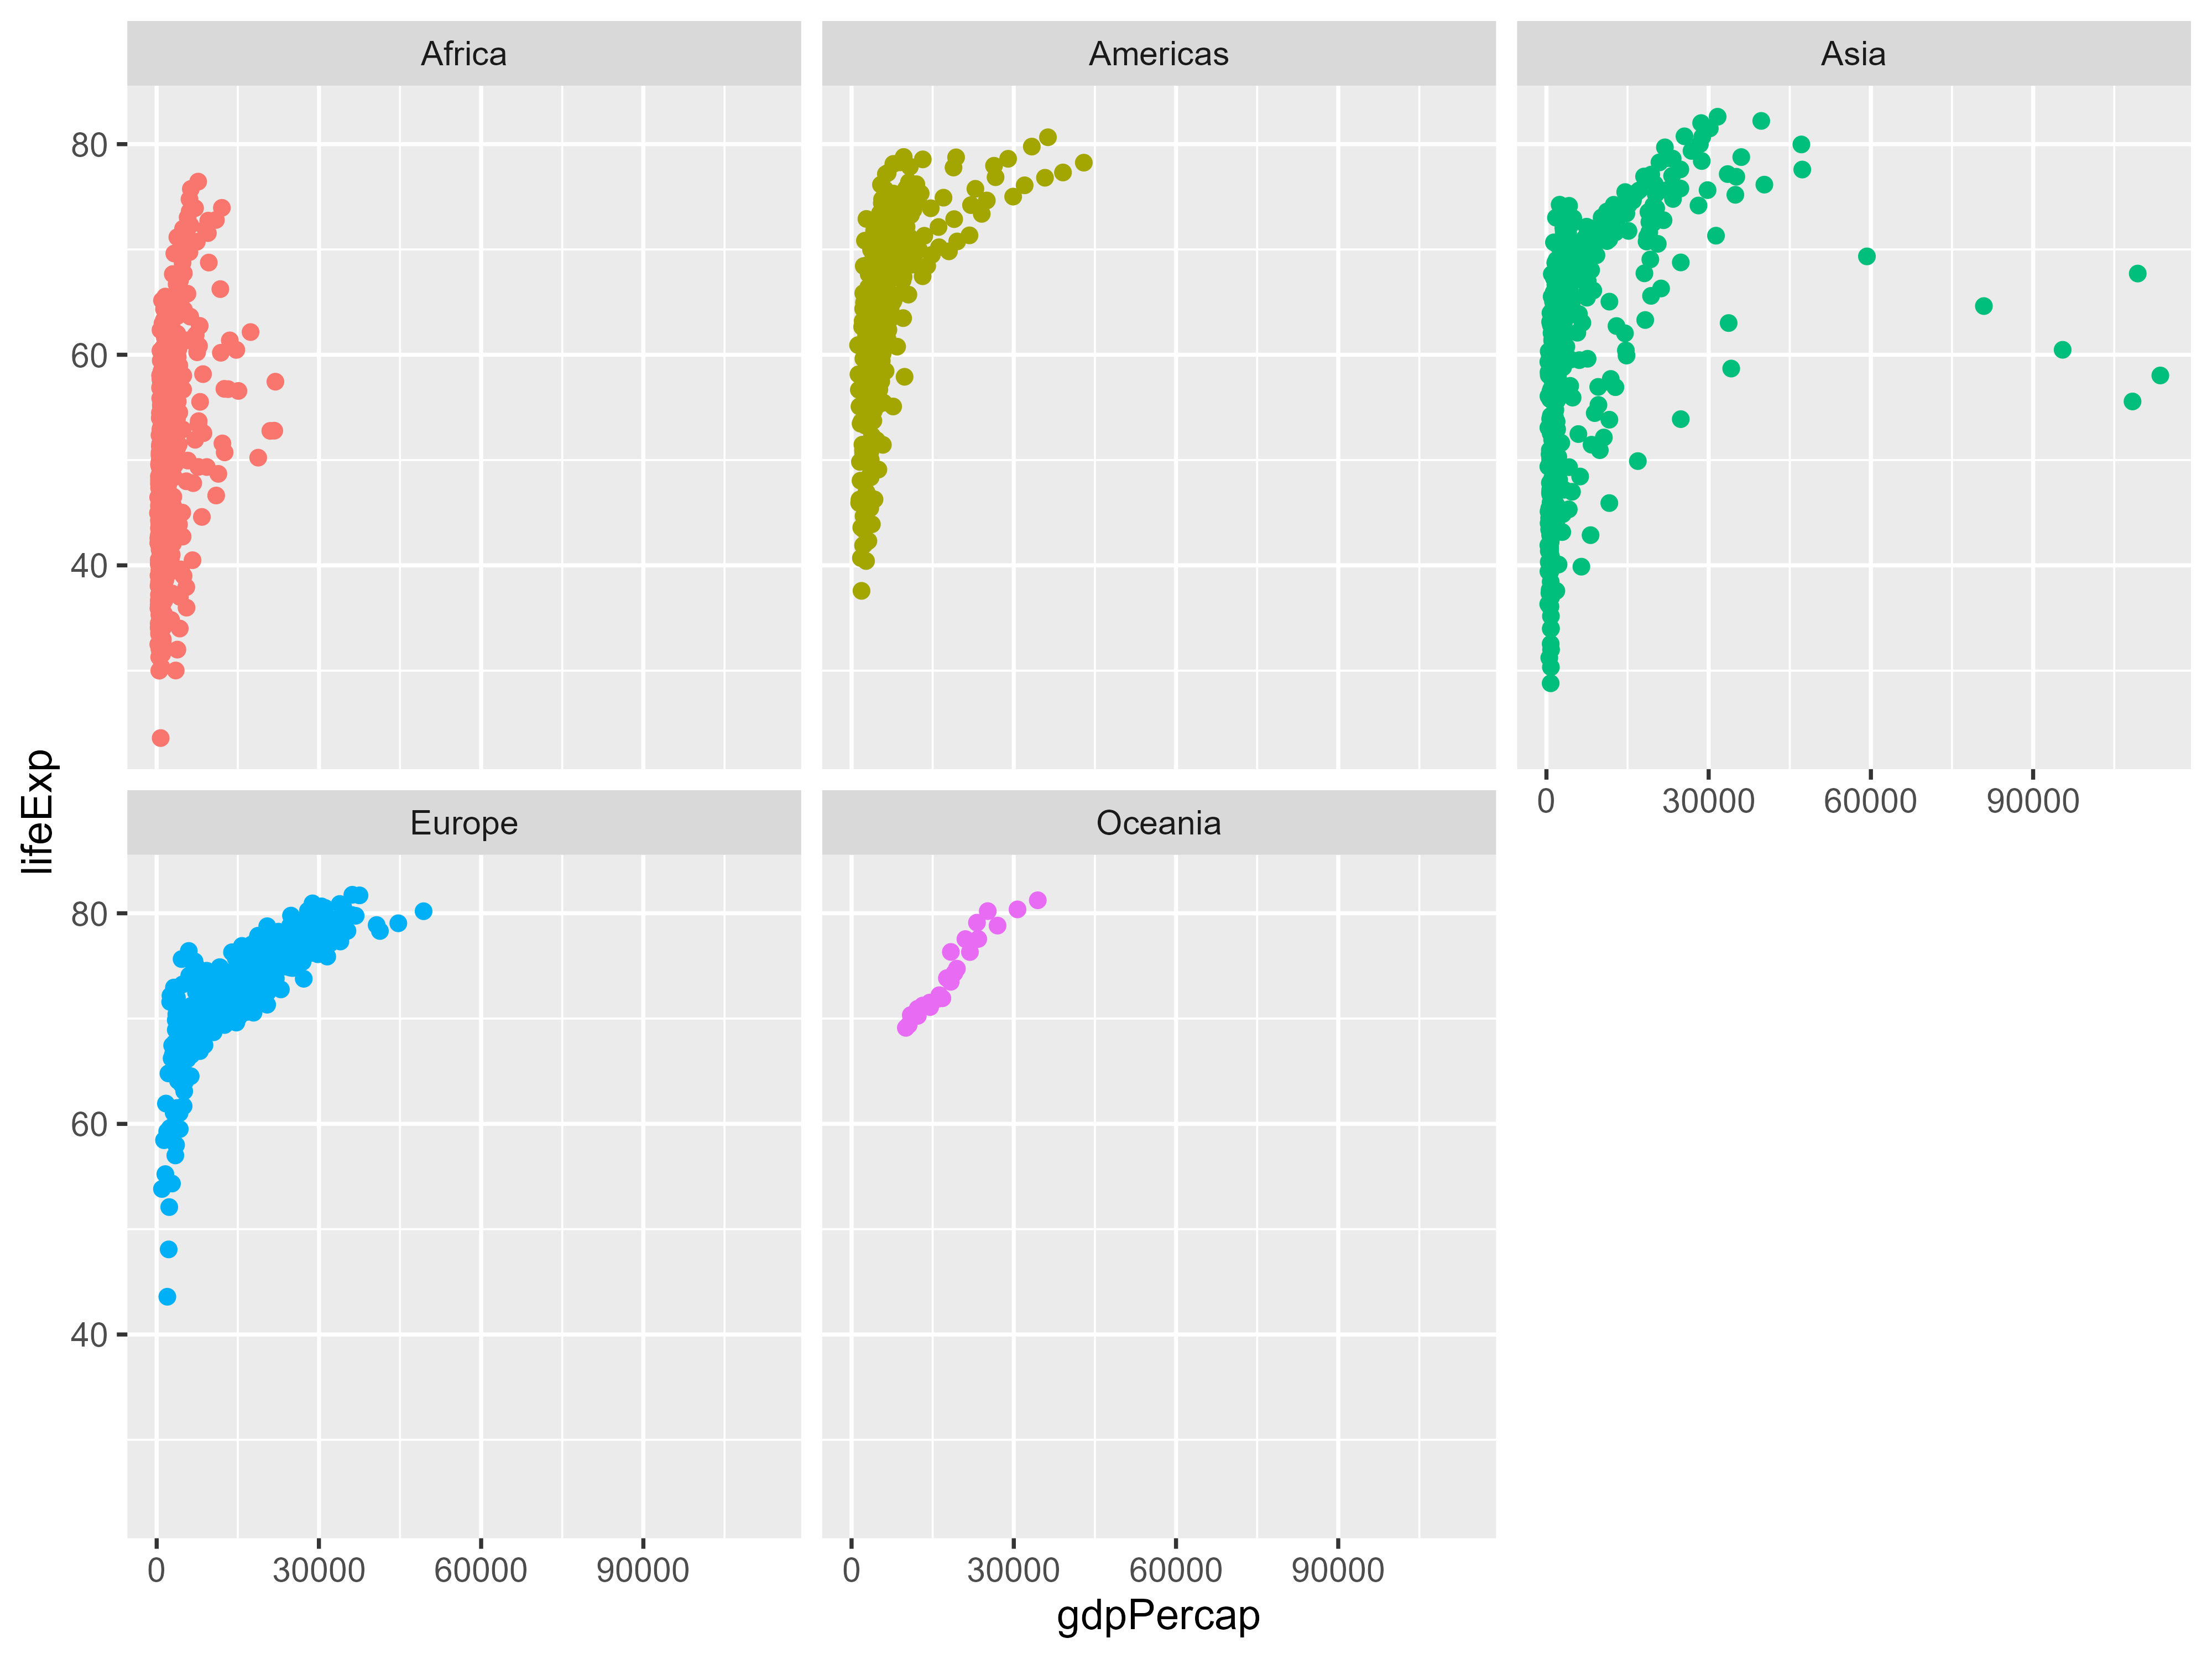
gapdata %>%
  ggplot(aes(x = log(gdpPercap), y = lifeExp)) +
  geom_point() +
  stat_ellipse(type = "norm", level = 0.95)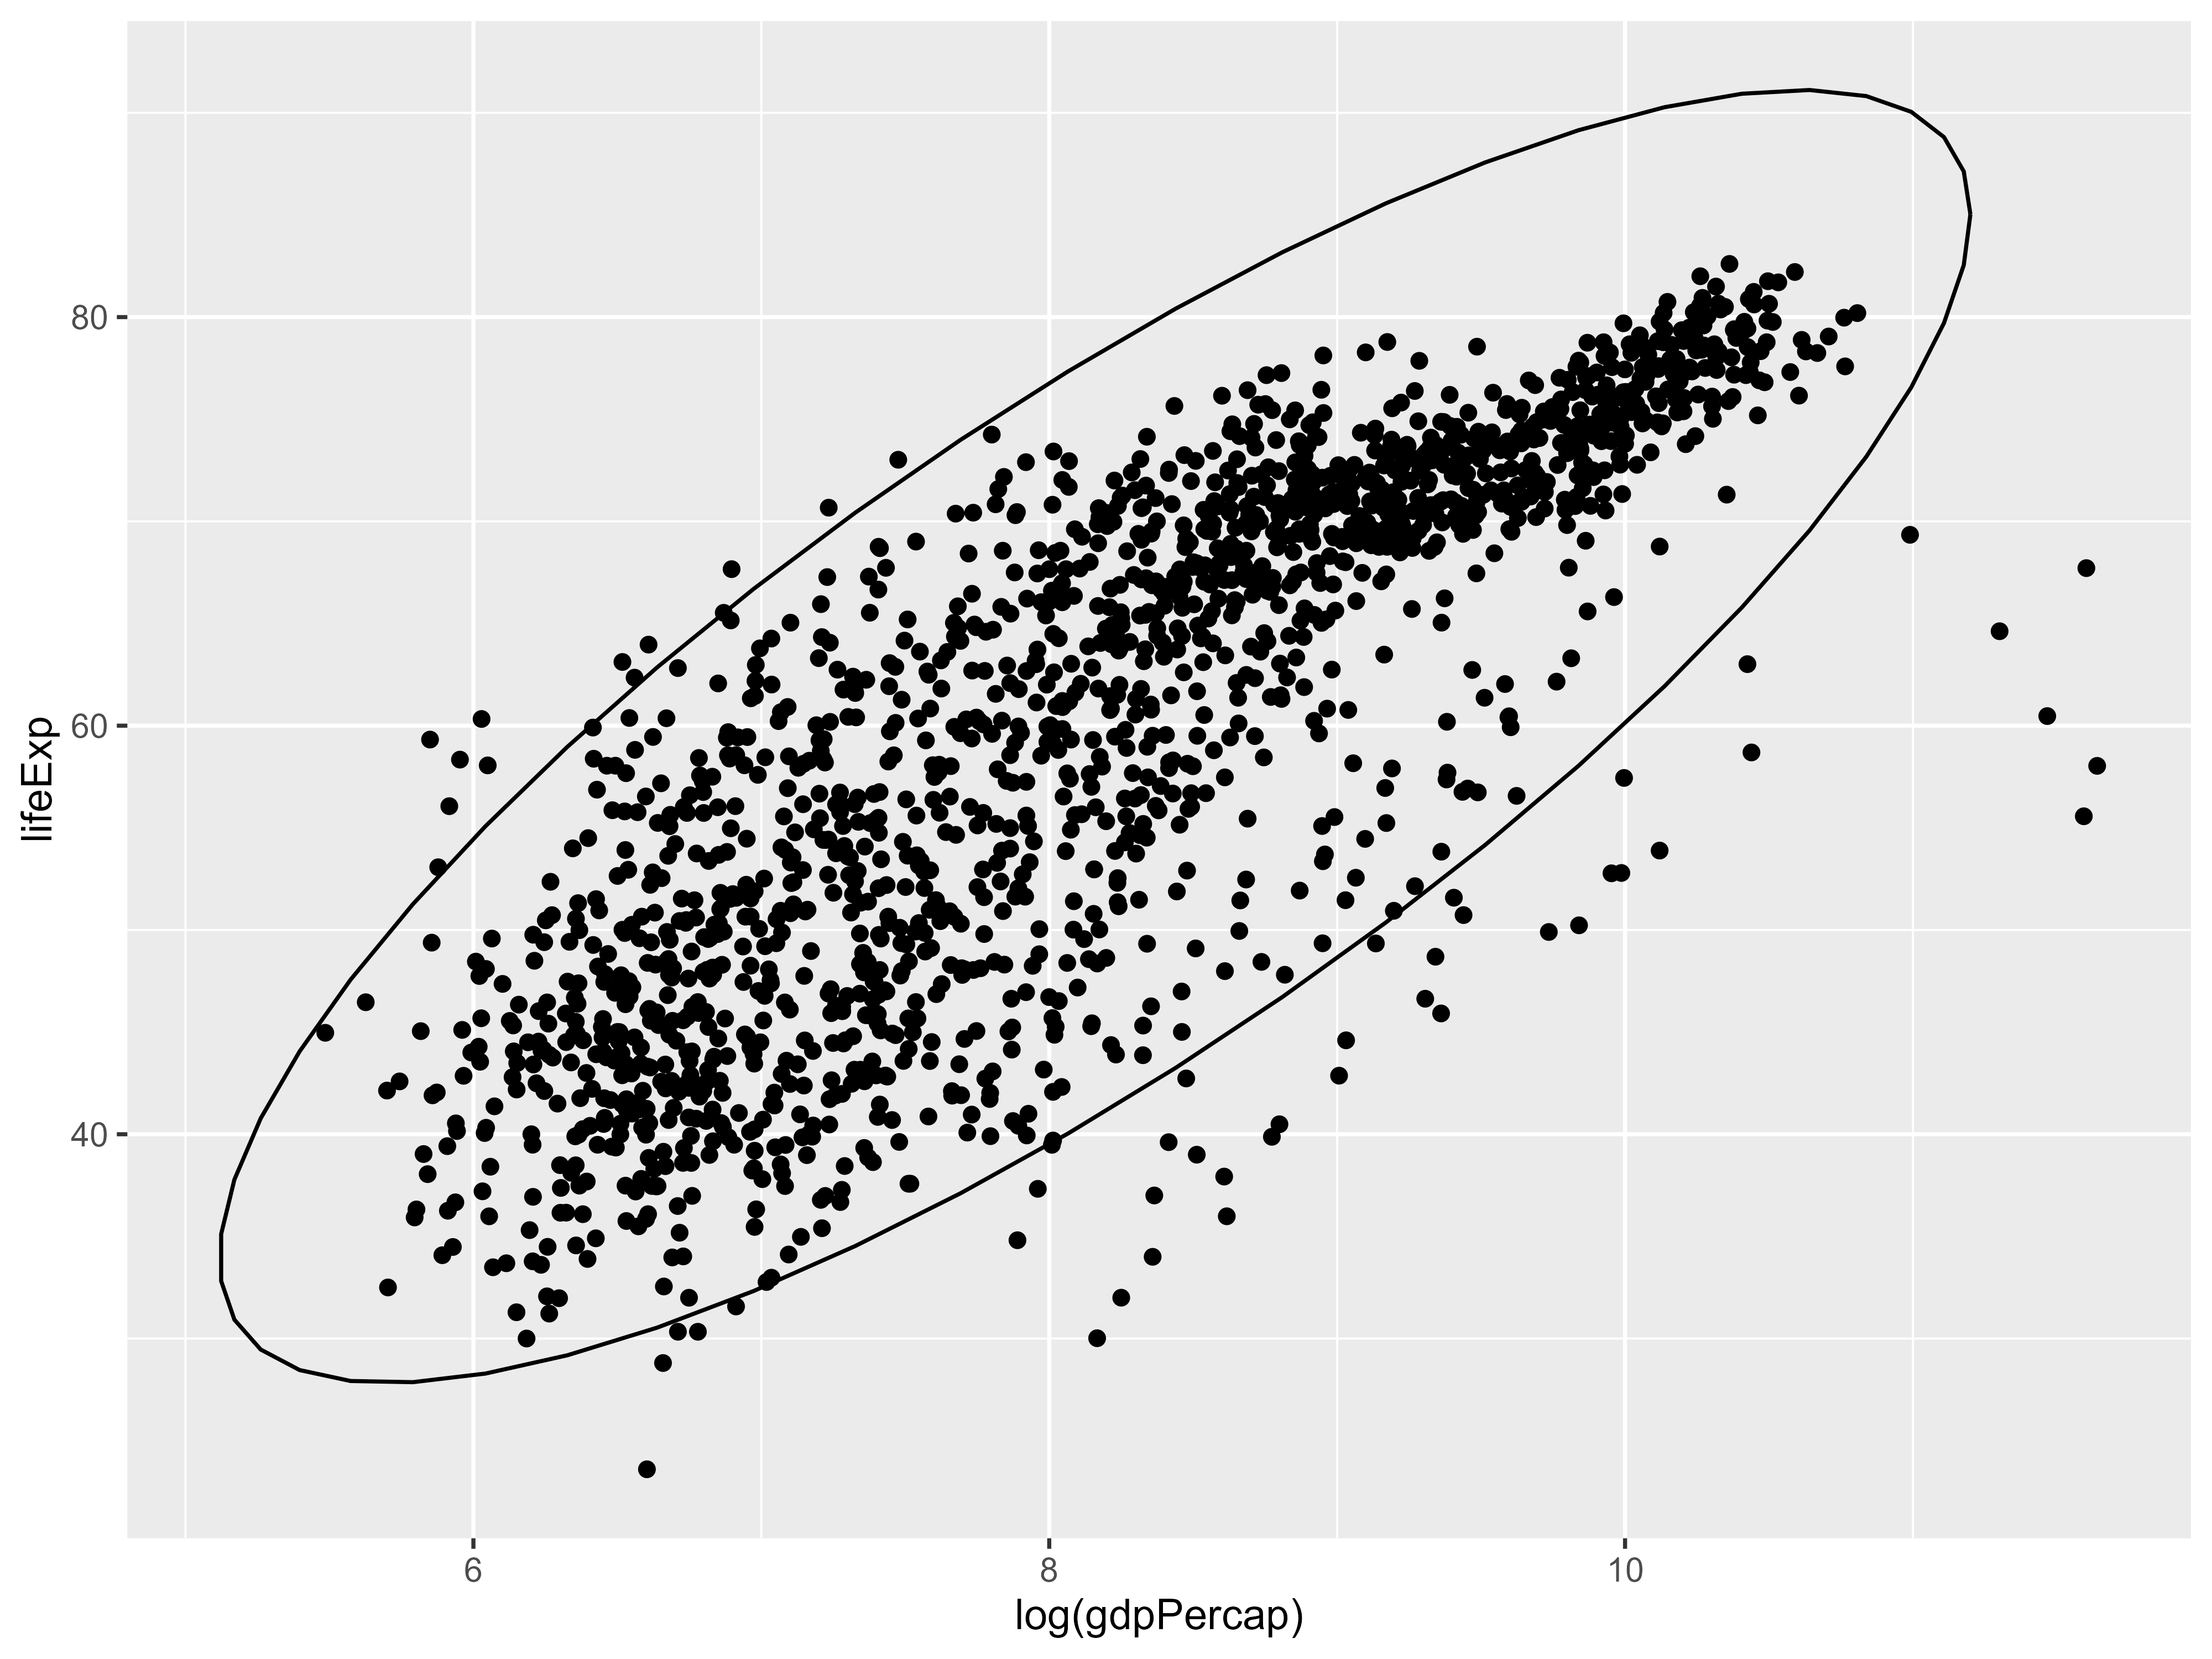
gapdata %>% filter(country == "China")
gapdata %>%
  ggplot(
    aes(x = year, y = lifeExp, color = continent, group = country)
  ) +
  geom_line() +
  gghighlight(
    country == "China", # which is passed to dplyr::filter().
    label_key = country
  )
ggplot(gapdata, aes(x = year, y = lifeExp,color = continent)) +
  geom_line(aes(group = country)) +
  gghighlight() +
  facet_wrap(~ continent)